comparto mi practica
import numpy as np
url = 'https://gist.githubusercontent.com/ahcamachod/9be09de793dc3bf1e6c3d98eb4e5b1ef/raw/21b85572693200040e11284ef6dcfc3457ec8e11/citrus.csv'
datos_citrus = np.loadtxt(url, delimiter=',', usecols=np.arange(1, 6, 1), skiprows=1)
datos_citrus
array([[ 2.96, 86.76, 172. , 85. , 2. ],
[ 3.91, 88.05, 166. , 78. , 3. ],
[ 4.42, 95.17, 156. , 81. , 2. ],
...,
[ 15.59, 256.5 , 168. , 82. , 20. ],
[ 15.92, 260.14, 142. , 72. , 11. ],
[ 16.45, 261.51, 152. , 74. , 2. ]])
Diametro_Naranja = datos_citrus[:5000, 0]
Diametro_Toronja = datos_citrus[5000:, 0]
Peso_Naranja = datos_citrus[:5000, 1]
Peso_Toronja = datos_citrus[5000:, 1]
print(Diametro_Naranja)
print(Diametro_Naranja)
2.96 3.91 4.42 ... 12.55 12.75 12.87]
print(Diametro_Toronja)
[ 7.63 7.69 7.72 ... 15.59 15.92 16.45]
print(Peso_Naranja)
86.76 88.05 95.17 ... 218.07 230.13 231.09]
print(Peso_Toronja)
[126.79 133.98 135.56 ... 256.5 260.14 261.51]
import matplotlib.pyplot as plt
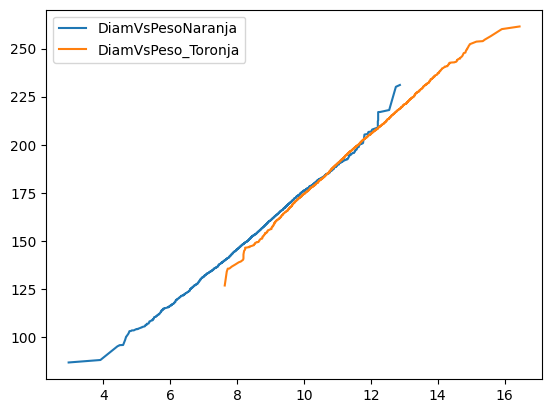
plt.plot(Diametro_Naranja, Peso_Naranja)
plt.plot(Diametro_Toronja, Peso_Toronja)
plt.legend(['DiamVsPesoNaranja', 'DiamVsPeso_Toronja'])
<matplotlib.legend.Legend at 0x7b13ebca5ad0>
Imagen