import pandas as pd
import matplotlib.pyplot as plt
from sklearn.model_selection import train_test_split
from sklearn.tree import DecisionTreeClassifier
from sklearn.ensemble import RandomForestClassifier
from sklearn.metrics import accuracy_score, confusion_matrix, ConfusionMatrixDisplay
df = pd.read_csv('/content/diabetes.csv')
# Separación en variables explicativas (X) y objetivo (y)
X = df.drop(columns=['diabetes'])
y = df['diabetes']
# Paso A: Separar el 5% para Prueba (Test) final
X_temp, X_test, y_temp, y_test = train_test_split(
X, y, test_size=0.05, stratify=y, random_state=42
)
# Paso B: Del 95% restante, separar el 25% para Validación
X_train, X_val, y_train, y_val = train_test_split(
X_temp, y_temp, test_size=0.25, stratify=y_temp, random_state=42
)
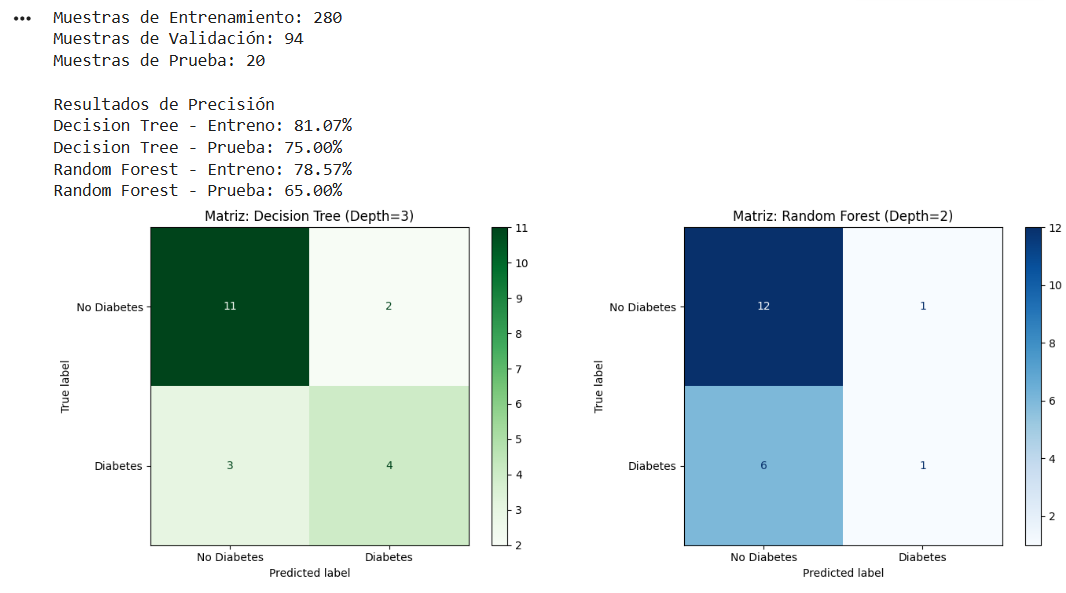
print(f"Muestras de Entrenamiento: {len(X_train)}")
print(f"Muestras de Validación: {len(X_val)}")
print(f"Muestras de Prueba: {len(X_test)}")
# Árbol de Decisión
dt_model = DecisionTreeClassifier(max_depth=3, random_state=42)
dt_model.fit(X_train, y_train)
# Random Forest
rf_model = RandomForestClassifier(max_depth=2, random_state=42)
rf_model.fit(X_train, y_train)
# Evaluación de precisión
print("\nResultados de Precisión")
print(f"Decision Tree - Entreno: {dt_model.score(X_train, y_train):.2%}")
print(f"Decision Tree - Prueba: {dt_model.score(X_test, y_test):.2%}")
print(f"Random Forest - Entreno: {rf_model.score(X_train, y_train):.2%}")
print(f"Random Forest - Prueba: {rf_model.score(X_test, y_test):.2%}")
# Matrices de Confusión
# Predicciones
y_pred_dt = dt_model.predict(X_test)
y_pred_rf = rf_model.predict(X_test)
fig, ax = plt.subplots(1, 2, figsize=(14, 5))
# Matriz para Decision Tree
cm_dt = confusion_matrix(y_test, y_pred_dt)
disp_dt = ConfusionMatrixDisplay(confusion_matrix=cm_dt, display_labels=['No Diabetes', 'Diabetes'])
disp_dt.plot(ax=ax[0], cmap='Greens')
ax[0].set_title('Matriz: Decision Tree (Depth=3)')
# Matriz para Random Forest
cm_rf = confusion_matrix(y_test, y_pred_rf)
disp_rf = ConfusionMatrixDisplay(confusion_matrix=cm_rf, display_labels=['No Diabetes', 'Diabetes'])
disp_rf.plot(ax=ax[1], cmap='Blues')
ax[1].set_title('Matriz: Random Forest (Depth=2)')
plt.tight_layout()
plt.show()