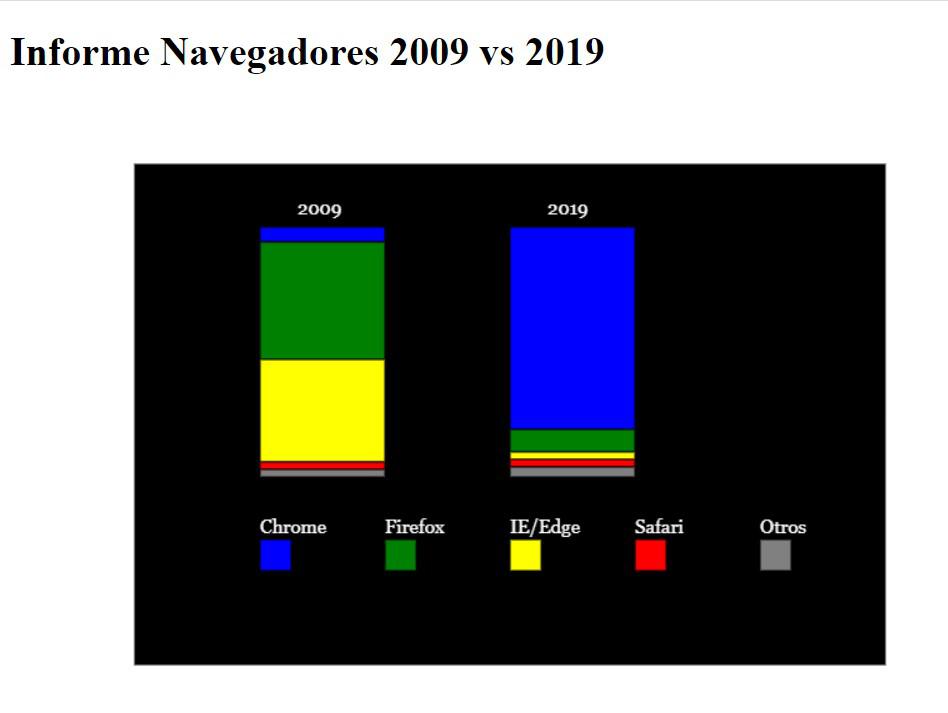
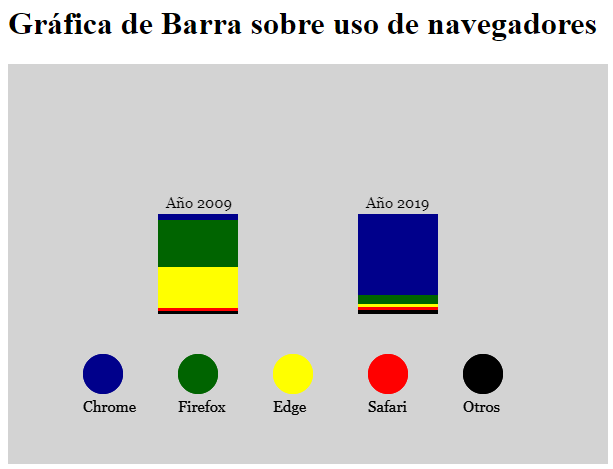
Buenas!, les paso el informe que hice según la consigna. Lo hice un distinto, calculo el porcentaje de acuerdo al tamaño de la barra total. Muy entretenido!
 Acá dejo el código:
<body>
    <h1>Informe Navegadores 2009 vs 2019</h1>
    <canvas width="800" height="800"></canvas>
    <script>

        var plano = document.querySelector("canvas");
        var pincel = plano.getContext("2d");

        var serie2009 = [6, 47, 41, 3, 3];
        var serie2019 = [81, 9, 3, 3, 4];
        var colores = ["blue", "green", "yellow", "red", "gray"];
        var navegadores = ["Chrome", "Firefox", "IE/Edge", "Safari", "Otros"];


        function dibujaRectangulo(x, y, base, altura, color) {
            pincel.fillStyle = color;
            pincel.fillRect(x, y, base, altura);
            pincel.strokeStyle = "black";
            pincel.strokeRect(x, y, base, altura);
            pincel.fill();
        }
        function escribeTexto(x, y, texto) {
            pincel.font = "15px Georgia";
            pincel.fillStyle = "white";
            pincel.fillText(texto, x, y);

        }

        function creaIndice(x, y, navegadores, colores) {
            var posicionX = x;
            var posicionY = y;


            for (i = 0; i < navegadores.length; i++) {
                dibujaRectangulo(posicionX, posicionY, 25, 25, colores[i]);
                escribeTexto(posicionX, posicionY - 5, navegadores[i]);
                posicionX = posicionX + 100;


            }

        }


        function dibujaBarra(x, y, base, altura, serie, colores, anio) {

            var barraAcumulada = y;

            escribeTexto(x + 30, y - 10, anio);

            for (i = 0; i < serie.length; i++) {

                porcentajeSerie = (altura * (serie[i] / 100));


                dibujaRectangulo(x, barraAcumulada, base, porcentajeSerie, colores[i]);

                barraAcumulada = barraAcumulada + porcentajeSerie;


            }

        }

        dibujaRectangulo(100, 50, 600, 400, "black")
        dibujaBarra(200, 100, 100, 200, serie2009, colores, "2009");
        dibujaBarra(400, 100, 100, 200, serie2019, colores, "2019");
        creaIndice(200, 350, navegadores, colores)


    </script>
</body>


