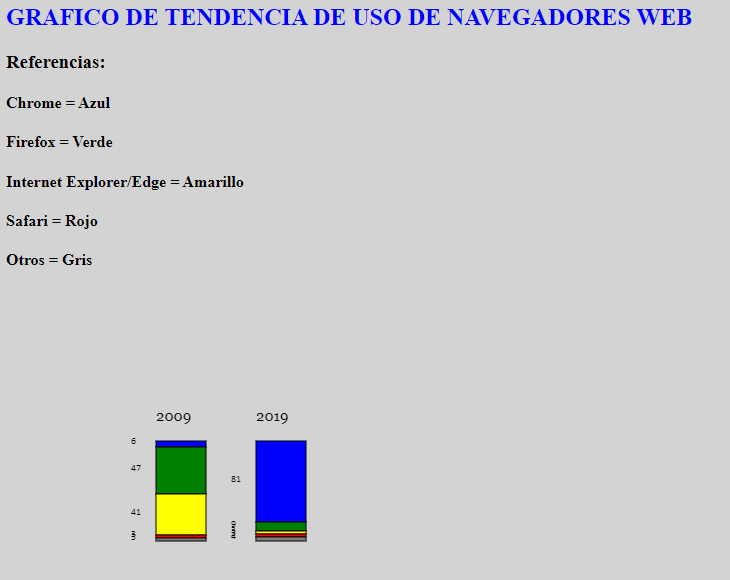
Buenas tardes! Les muestro mi aporte al ejercicio de Grafico de Barras, al que le agregue las leyendas y los valores de cada item:
 Aqui está el codigo:
<meta charset="utf-8">
<style>
h2 {
  color: blue;
  text-align: left;
}
h4 {
  color: black;
  text-align: left;
}
body{
    background-color: lightgrey;
}
</style>

<h2>GRAFICO DE TENDENCIA DE USO DE NAVEGADORES WEB</h2>
<div>
<h3>Referencias:</h3>
<h4>Chrome = Azul</h4>
<h4>Firefox = Verde</h4>
<h4>Internet Explorer/Edge = Amarillo</h4>
<h4>Safari = Rojo</h4>
<h4>Otros = Gris</h4>
</div>
<canvas width="600" height="400"></canvas>


<script>
    var serie2009 = [6,47,41,3,3];
    var serie2019 = [81,9,3,3,4];
    var colores = ["blue","green","yellow","red","grey"];


    function dibujarRectangulo(x, y, base, altura, color) {
        var pantalla = document.querySelector("canvas");
        var pincel = pantalla.getContext("2d");

        pincel.fillStyle=color;
        pincel.fillRect(x,y, base, altura);
        pincel.strokeStyle="black";
        pincel.strokeRect(x,y, base, altura);
    }

    function escribirTexto(x , y, texto) {
        var pantalla = document.querySelector("canvas");
        var pincel = pantalla.getContext("2d");
        pincel.font="15px Georgia";
        pincel.fillStyle="black";
        pincel.fillText(texto, x, y);
    }

    function escribirRotulos(x , y, texto) {
        var pantalla = document.querySelector("canvas");
        var pincel = pantalla.getContext("2d");
        pincel.font="10px Calibri";
        pincel.fillStyle="black";
        pincel.fillText(texto, x, y);
    }

        var posicion1 = 150;
        var posicion2 = 150;

        escribirTexto(150,posicion1-20,"2009");
        escribirTexto(250,posicion1-20,"2019");

        for(y=0;y<5;y=y+1){
            dibujarRectangulo(150,posicion1,50,serie2009[y],colores[y]);
            escribirRotulos(125,posicion1 + serie2009[y]/2,serie2009[y]);
            posicion1 = posicion1 +serie2009[y];

            }
        for(y=0;y<5;y=y+1){
            dibujarRectangulo(250,posicion2,50,serie2019[y],colores[y]);
            escribirRotulos(225,posicion2 + serie2019[y]/2,serie2019[y]);
            posicion2 = posicion2 +serie2019[y];

            }

</script>


