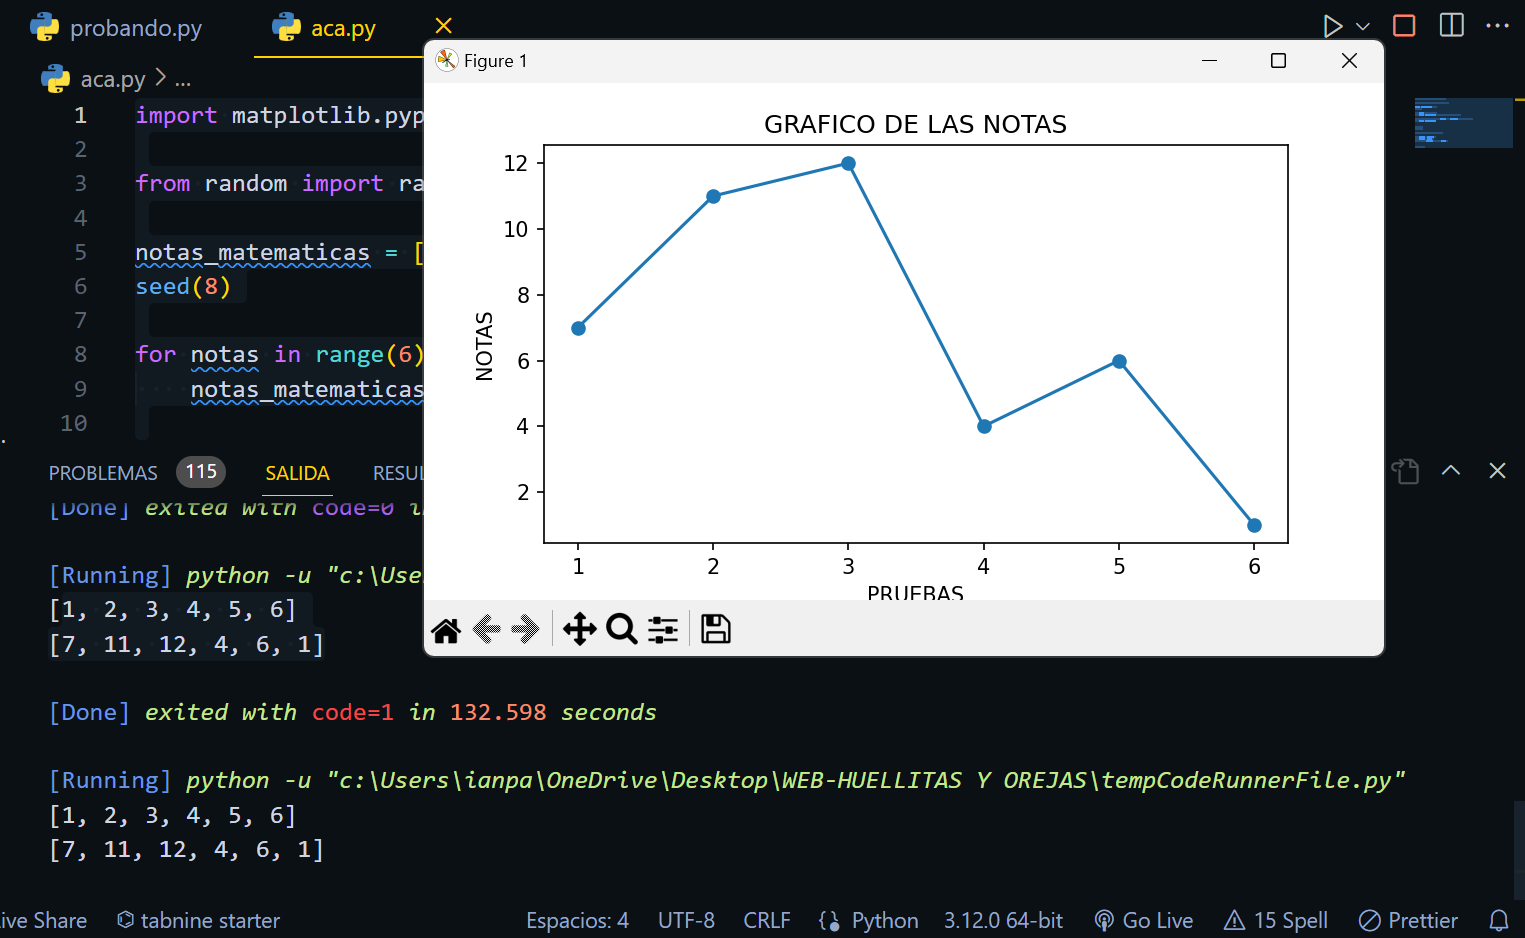
import matplotlib.pyplot as plt
from random import randrange, seed
notas_matematicas = [] seed(8)
for notas in range(6): notas_matematicas.append(randrange(0, 20))
x = list(range(1, 7)) # Ajusta la longitud de x a la de y y = notas_matematicas
print(x) print(y)
plt.plot(x, y, marker = 'o')
plt.xlabel('PRUEBAS') plt.ylabel('NOTAS') plt.title('GRAFICO DE LAS NOTAS')
plt.show()
DESEO SABER EL PORQUE CUANDO GRAFICA NO SALE LO MISMO QUE EN LA TERMINA, OSEA ME REFIERO AL EJE Y , por favor necesito que me expliquen un poco mejor ese aspecto de como funciona


