colors = ['pink', 'purple', 'blue', 'violet']
tiendas = ['A', 'B', 'C', 'D']
fig, axs = plt.subplots(2, 2, figsize=(10, 6))
fig.subplots_adjust(hspace=0.5, wspace=0.3)
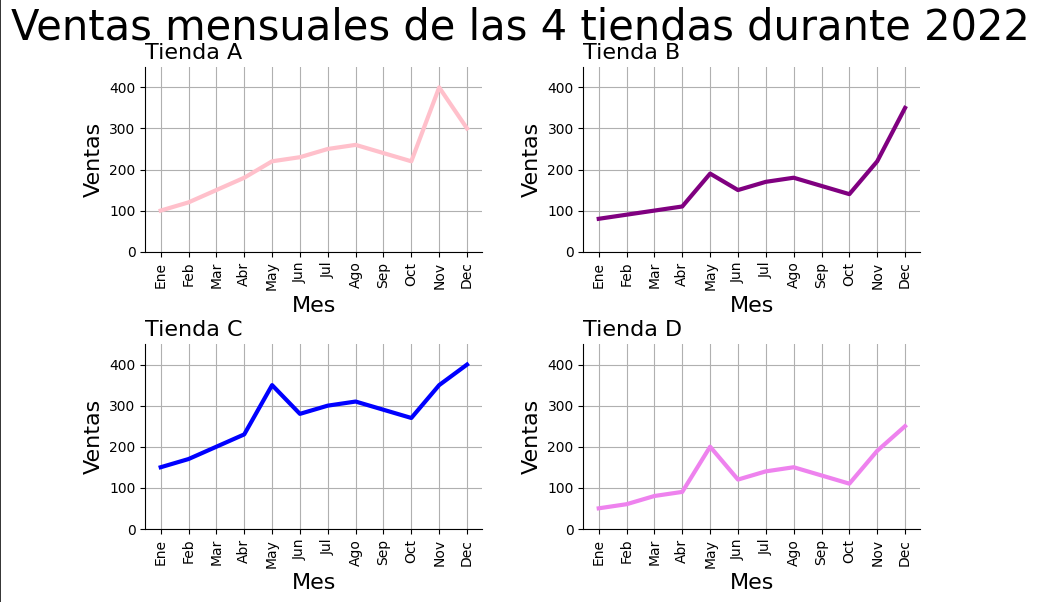
fig.suptitle('Ventas mensuales de las 4 tiendas durante 2022', fontsize=30)
for ax, tienda, color, title_loc in zip(
axs.ravel(), tiendas, colors, ['left', 'left', 'left', 'left']):
ax.plot(df.columns, df.loc[tienda], lw=3, color=color)
ax.set_title(f'Tienda {tienda}', fontsize=16, loc=title_loc)
ax.set_ylim(0, 450)
ax.set_xlabel('Mes', fontsize=16)
ax.set_ylabel('Ventas', fontsize=16)
ax.grid()
ax.spines['top'].set_visible(False)
ax.spines['right'].set_visible(False)
ax.set_xticklabels(ax.get_xticklabels(), rotation=90)
plt.show()