import plotly.graph_objs as go
import plotly.graph_objs as go # Biblioteca para gráficos interactivos
# Creamos la figura base
fig = go.Figure()
# Agregamos la línea de Argentina con el primer punto
fig.add_trace(
go.Scatter(
x=[df_argentina['Año'].iloc[0]],
y=[df_argentina['Inmigrantes'].iloc[0]],
mode='lines',
name='Argentina',
line=dict(width=4, color='#1295bf'),
hovertemplate='Año: %{x}<br>Inmigrantes: %{y}<extra></extra>'
)
)
# Agregamos la línea de Brasil con el primer punto
fig.add_trace(
go.Scatter(
x=[df_brasil['Año'].iloc[0]],
y=[df_brasil['Inmigrantes'].iloc[0]],
mode='lines',
name='Brasil',
line=dict(width=4, color='#a8bb09'),
hovertemplate='Año: %{x}<br>Inmigrantes: %{y}<extra></extra>'
)
)
# Configuración del diseño general del gráfico
fig.update_layout(
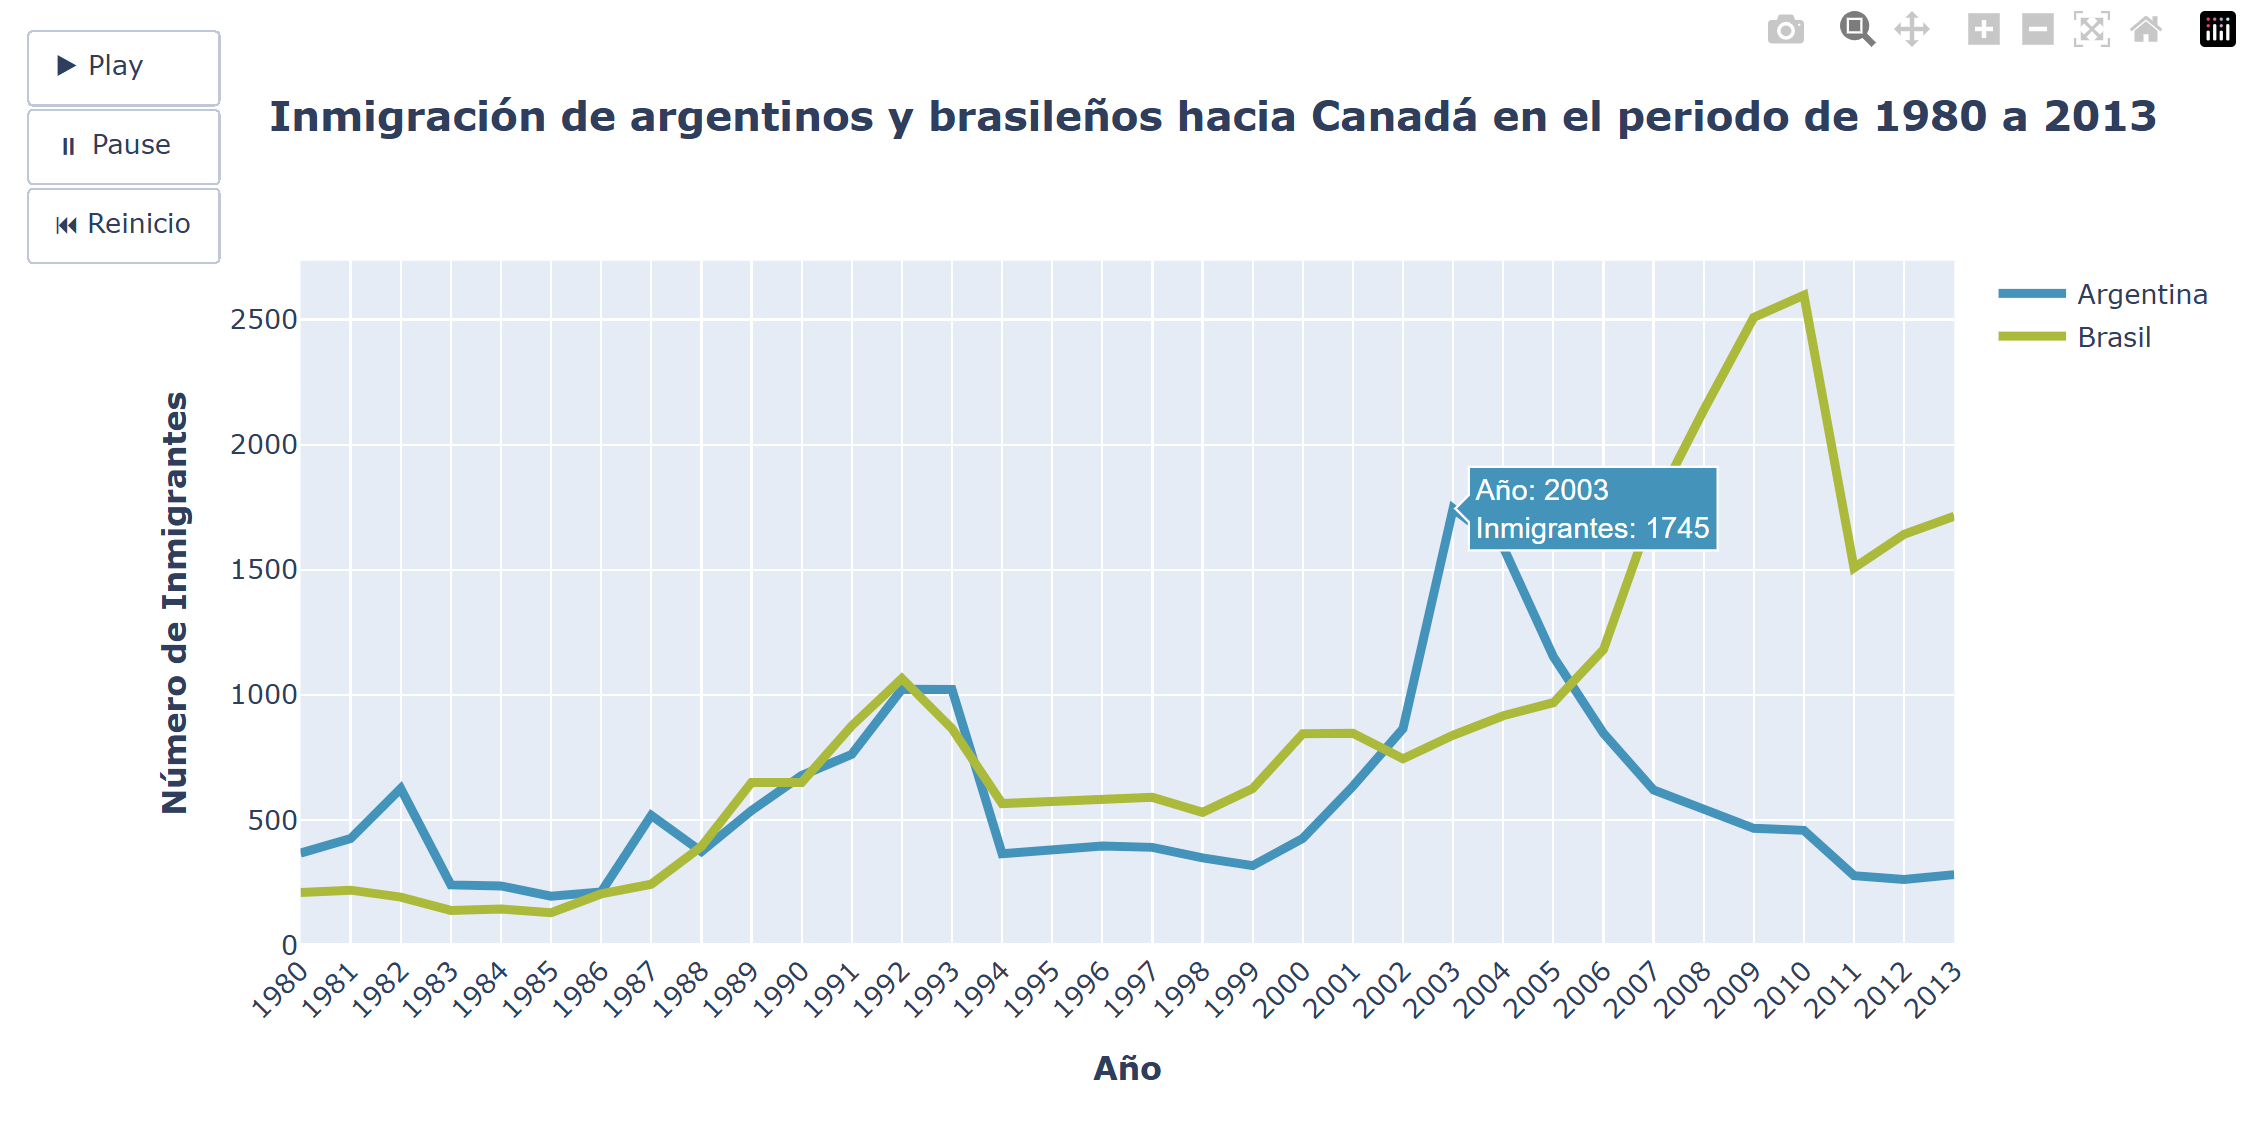
title=dict(
text='<b>Inmigración de argentinos y brasileños hacia Canadá en el periodo de 1980 a 2013</b>',
x=0.12,
xanchor='left',
font=dict(size=18)
),
xaxis=dict(
autorange=True,
title='<b>Año</b>',
tickangle=-45
),
yaxis=dict(
autorange=True,
title='<b>Número de Inmigrantes</b>'
),
updatemenus=[
dict(
type='buttons',
showactive=False,
xanchor='right',
yanchor='bottom',
buttons=[
dict(
label='▶ Play',
method='animate',
args=[None, {
'frame': {'duration': 400, 'redraw': True},
'fromcurrent': True,
'mode': 'immediate'
}]
),
dict(
label='⏸ Pause',
method='animate',
args=[[None], {
'frame': {'duration': 0, 'redraw': False},
'mode': 'immediate'
}]
),
dict(
label='⏮ Reinicio',
method='animate',
args=[['frame0'], {
'frame': {'duration': 0, 'redraw': True},
'mode': 'immediate',
'transition': {'duration': 0}
}]
)
]
)
],
width=1000,
height=500
)
# Creamos los frames para la animación, uno por cada fila del DataFrame
frames = [
go.Frame(
name=f'frame{i}',
data=[
go.Scatter(x=df_argentina['Año'].iloc[:i+1], y=df_argentina['Inmigrantes'].iloc[:i+1], line=dict(width=4, color='#1295bf')),
go.Scatter(x=df_brasil['Año'].iloc[:i+1], y=df_brasil['Inmigrantes'].iloc[:i+1], line=dict(width=4, color='#a8bb09'))
],
layout=go.Layout(
yaxis=dict(autorange=True)
)
)
for i in range(len(df_argentina)+1)
]
# Asignamos los frames a la figura
fig.frames = frames
# Guardamos el gráfico animado como un archivo HTML
fig.write_html('/content/drive/MyDrive/Pandas_4/arg_bra_animado.html')
# Mostramos el gráfico animado
fig.show()